
Telco Cloud Monitoring: Observability with Prometheus and Grafana
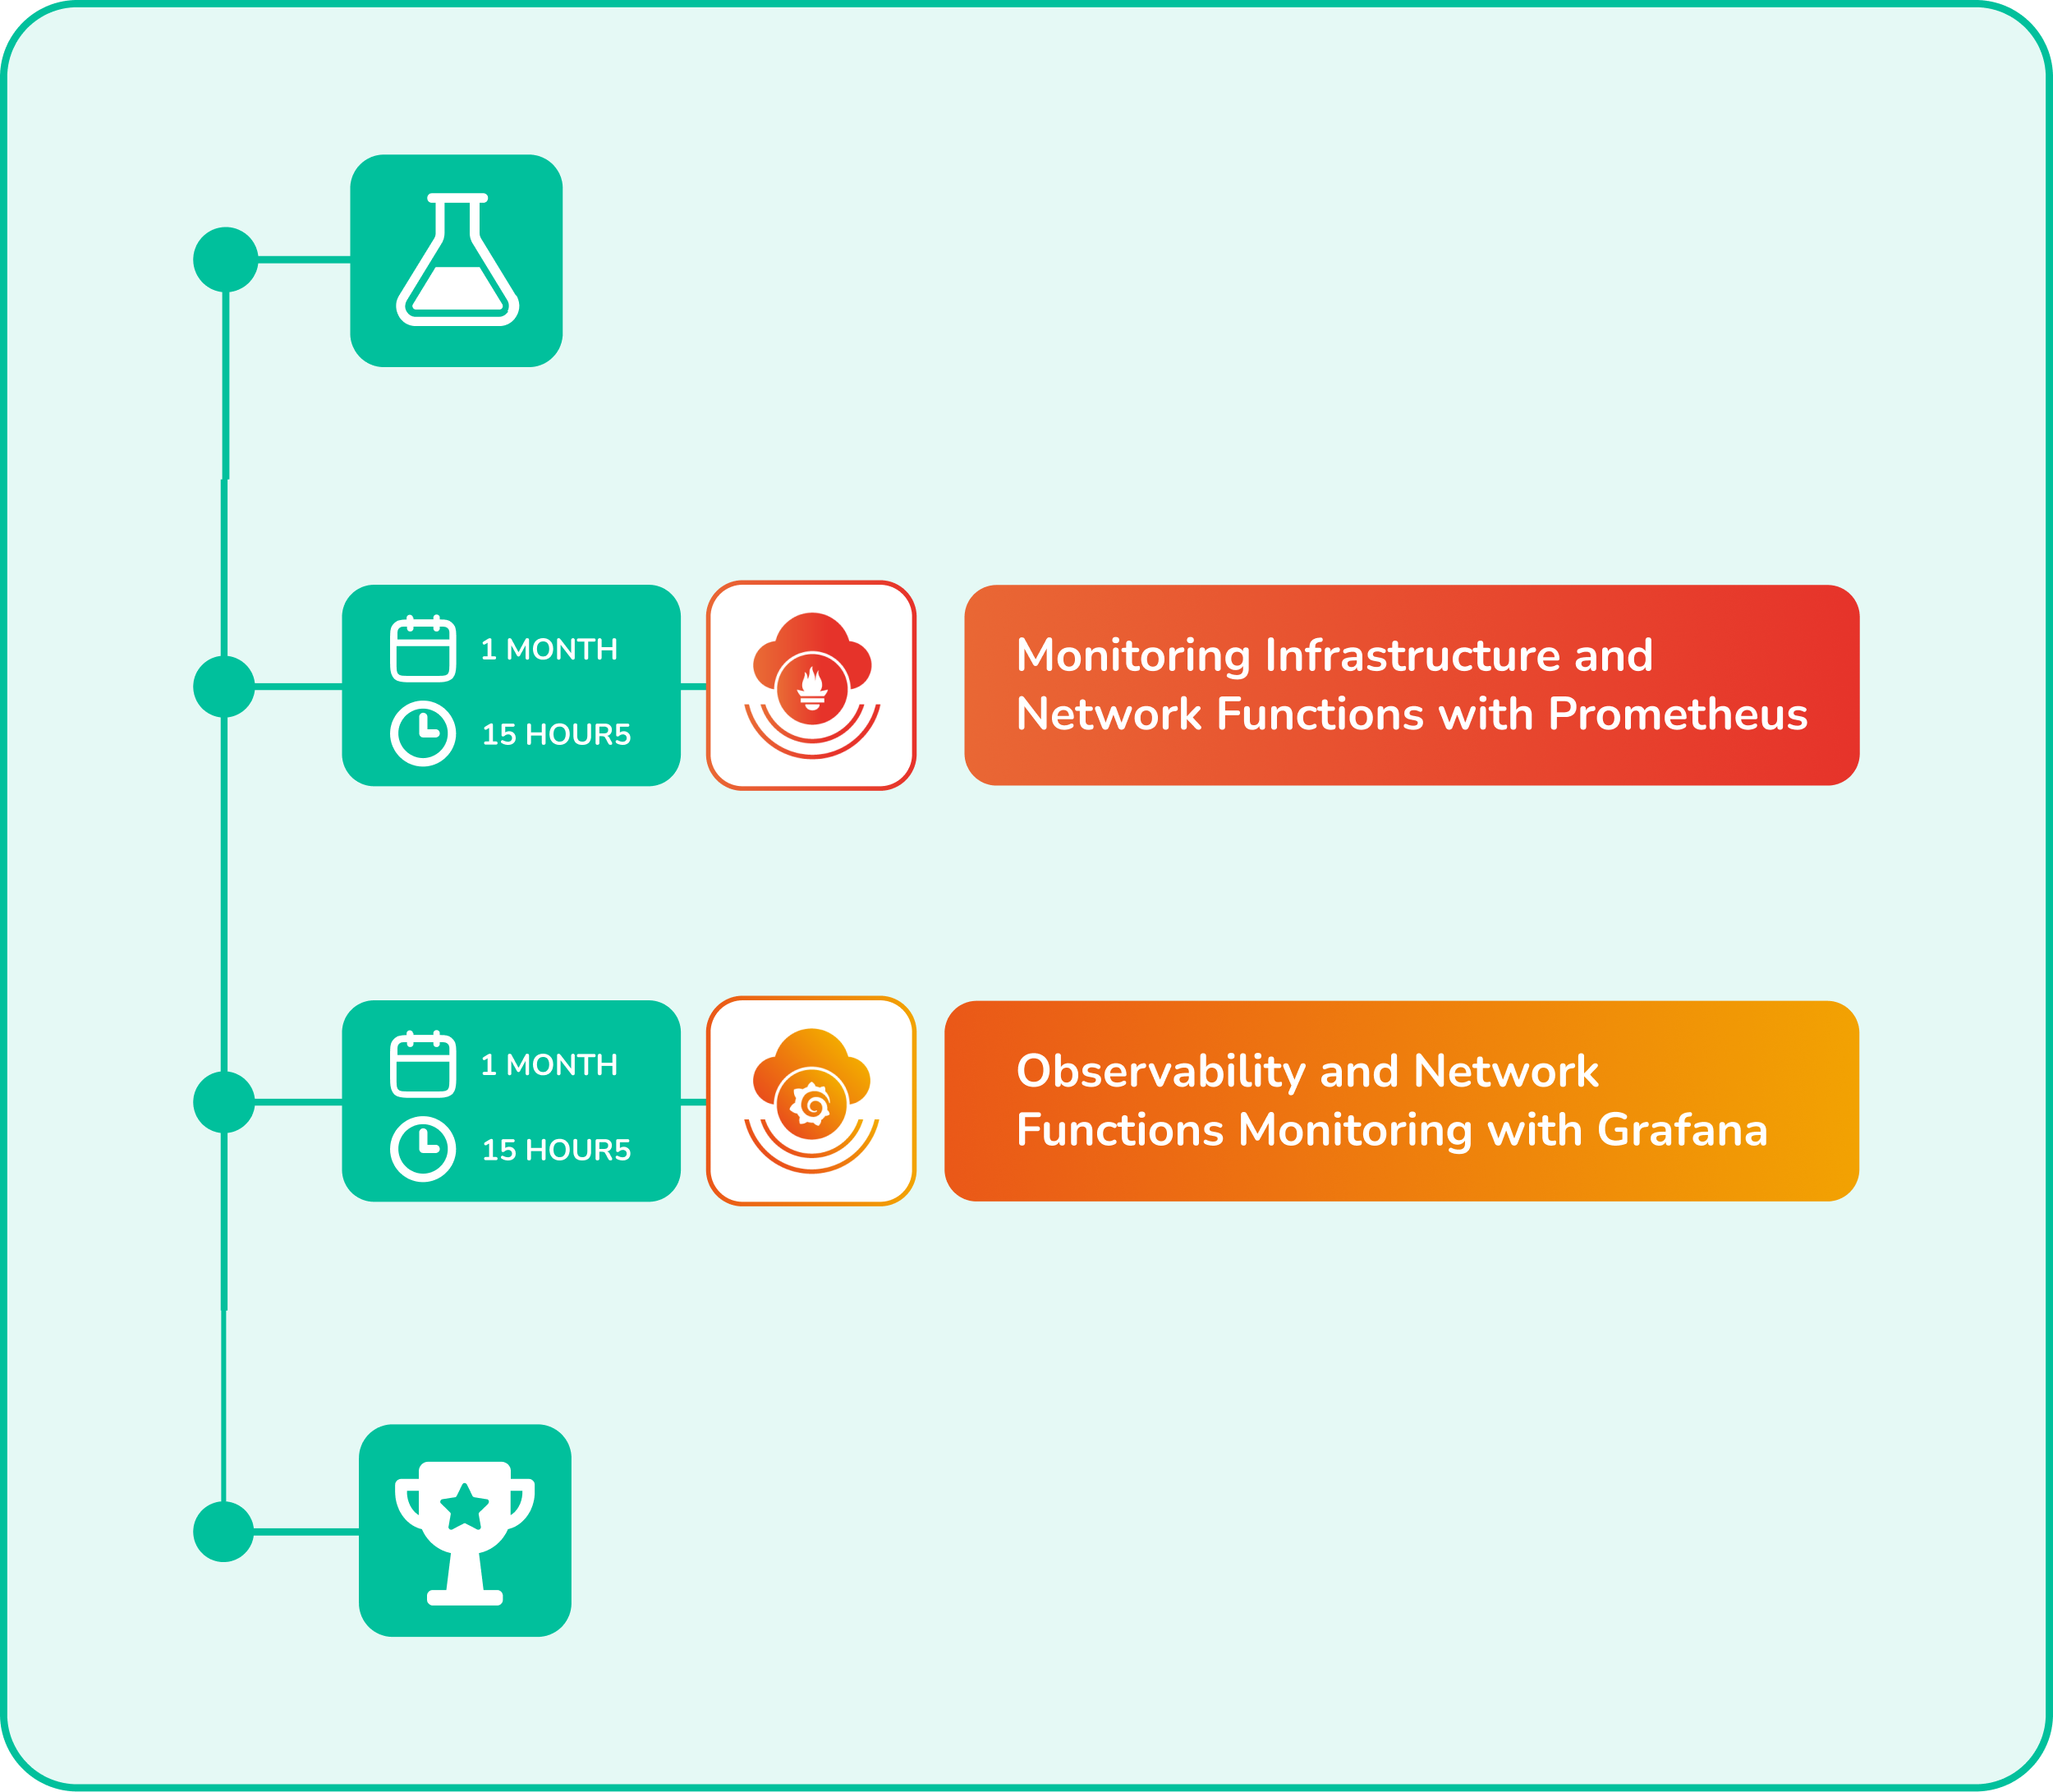
This Learning Path introduces you to monitoring and observability in the Telco Cloud using Prometheus and Grafana, with a focus on telecom-grade environments. You’ll begin by learning the fundamentals of metrics-driven monitoring, followed by hands-on labs where you set up Prometheus for metrics collection, configure service discovery for dynamic telecom workloads, and define alerting rules aligned with telco SLAs. You’ll then use Grafana to create real-time dashboards that visualize network health, performance, and KPIs, while integrating exporters to capture both Kubernetes telemetry and telecom-specific metrics. The path concludes with a practical project where you design and implement a monitoring stack that simulates real-world telecom scenarios, ensuring reliable and scalable observability for CNFs and telco cloud infrastructure.
About The Learning path
Audiences
Learning Path Flow:

Lab Architecture
The lab architecture seamlessly integrates Prometheus with a range of exporters to create a comprehensive monitoring environment for infrastructure and network functions. It includes a Prometheus server that collects metrics from Linux hosts and Telco workloads using the Node Exporter. A 5G core simulation is instrumented to expose real-time service metrics, while Grafana provides a lightweight visualization layer to observe system behavior and validate alerting strategies.

Lab Objectives
- Understand Prometheus architecture and its role in observability.
- Collect and analyze metrics from infrastructure and Telco workloads.
- Write PromQL queries to monitor system behavior.
- Configure alerting rules and manage incidents with Alertmanager.
- Visualize key metrics using Grafana dashboards.
Lab Architecture
The lab architecture leverages Grafana as the central observability platform, seamlessly integrating with multiple data sources such as Prometheus, SQL databases, and JSON APIs. Participants will explore how Grafana visualizes and correlates data across diverse systems—including a 5G core simulation—while practicing dashboard creation, alarm integration, and advanced observability features to validate monitoring strategies effectively.

Lab Objectives
- Understand Grafana architecture and its role in observability.
- Integrate Grafana with diverse data sources such as Prometheus, SQL, and JSON.
- Build and customize dashboards to visualize system and network metrics.
- Configure alerts and notification channels for proactive incident management.
- Apply advanced Grafana features to monitor complex workloads, including 5G environments.
Related Learning Paths
Explore LabLabee’s curated Telco Cloud & Enterprise Learning Paths